
|
||||||
|---|---|---|---|---|---|---|
| Echocardiography 5 minutes before starting
|
||||||
Cardiac function and PA pressure |
||||||
|
—Echocardiographic examinations |
—Cardiac function and PA pressure |
—Examples of pathological |
||||
| Diastolic LV function | ||||||
|
|
||||||
|
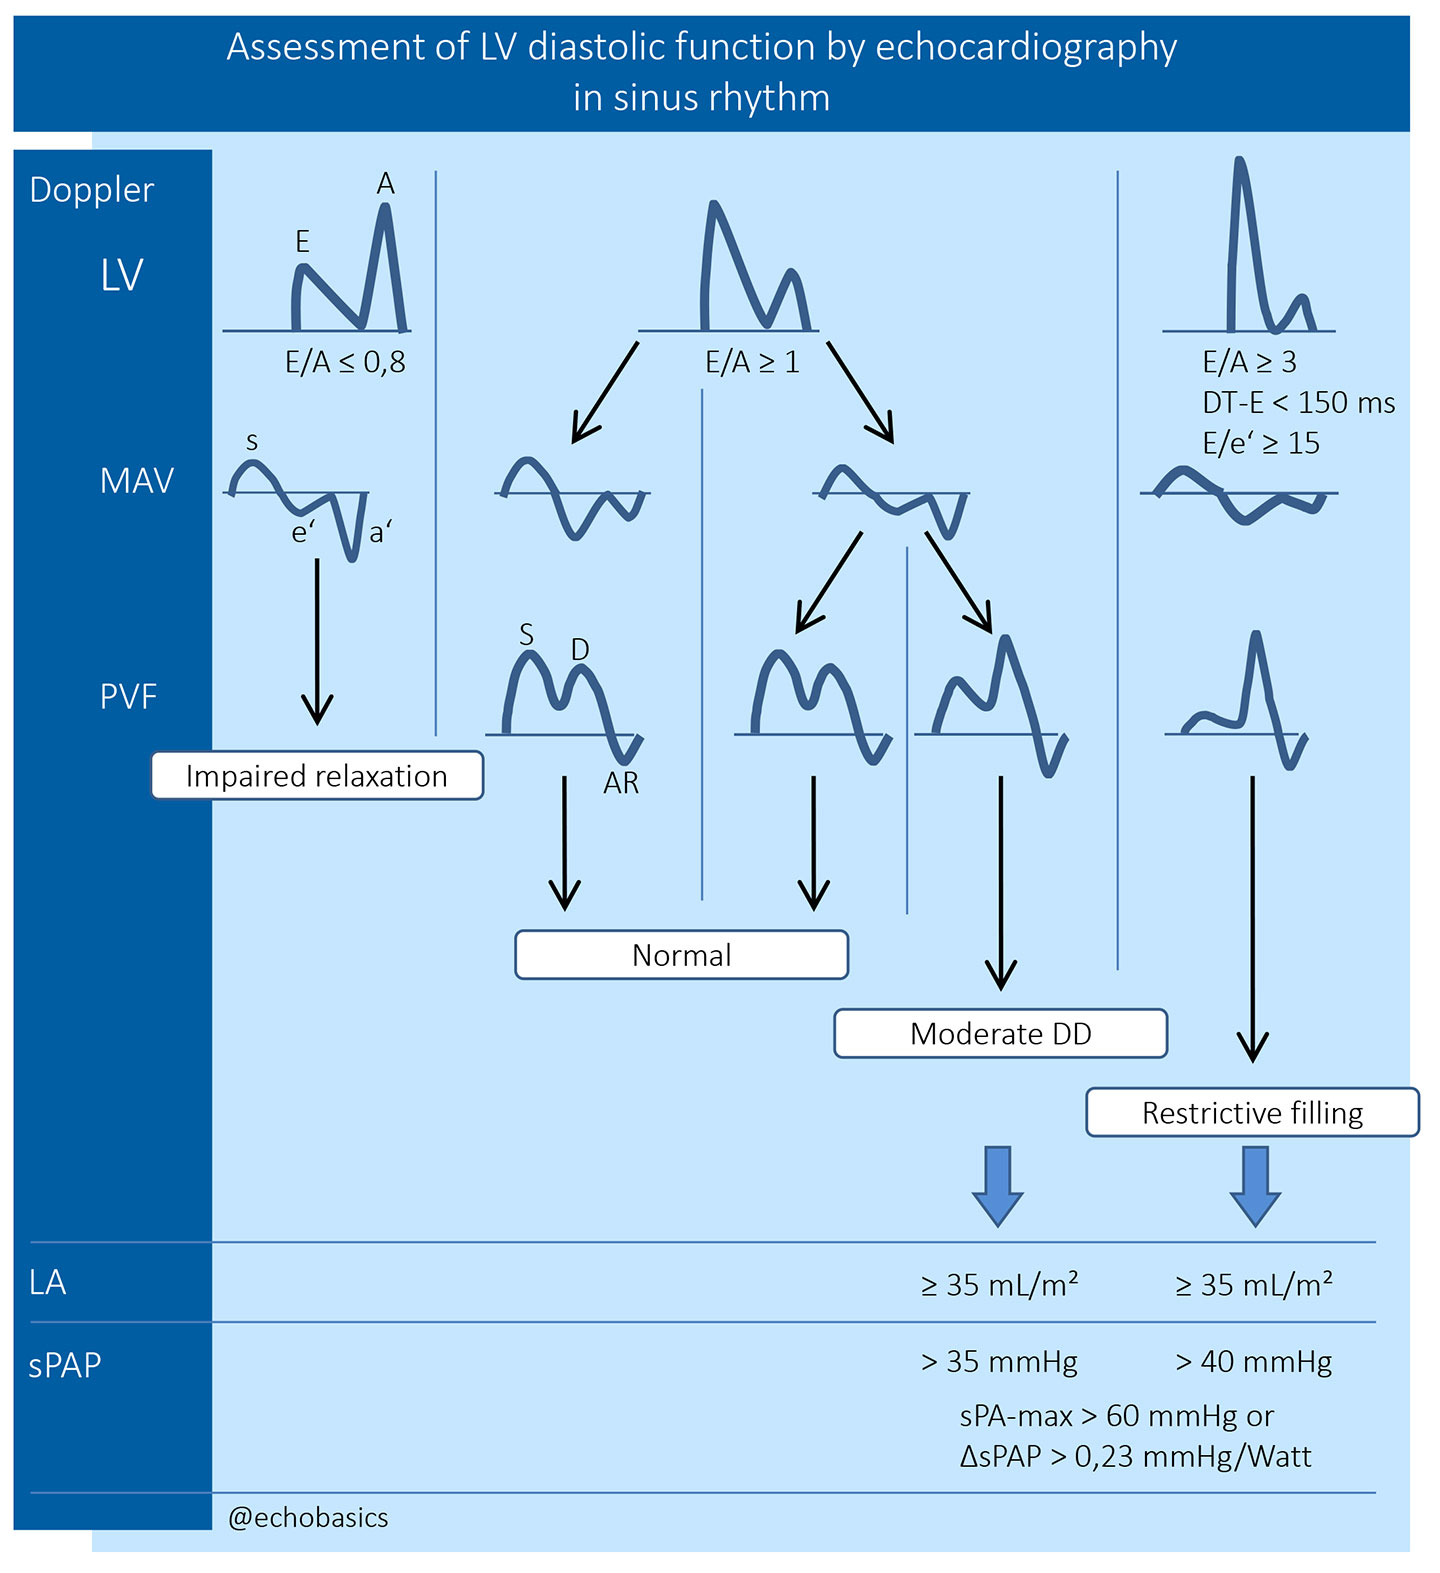
Guidelines and Standards Recommendations for the Evaluation of Left Ventricular Diastolic Function by Echocardiography, 2016
A prerequisite to assessment of diastolic LV function is the capability of the method to measure
pressures, and Doppler echocardiography is only able to measure velocities. Only through
application of formulas, as the modified Bernoulli equation (V² · 4 = ΔP)
it is possible to estimate pressure gradients. |
||||||
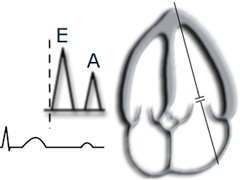
Mitral inflow velocities examination |
||||||
|
Left: PW-Doppler sample volume is placed
at the tips of the mitral valve in the left ventricle. |
|||||
|
|
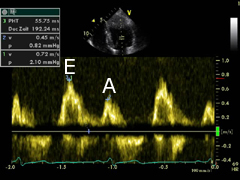
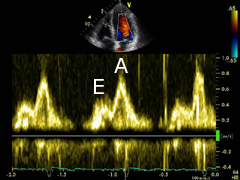
Left: pulsed wave (PW) Doppler spectral display
shows an E-wave with higher velocities, as well as an end-diatolic A-wave with lower velocities. |
||||
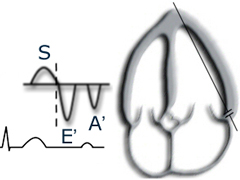
Mitral annular velocities examination |
||||||
|
Left: PW-TDI sample volume is place at the level of the
lateral mitral annulus.
|
|||||
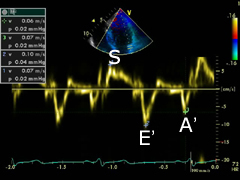
|
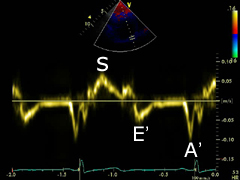
|
Left: spectral tissue Doppler (TDI) display shows an antegrade sys- tolic,
and two retrograde waves, E' (passive LV filling) and A'-wave (atrial contraction). |
||||
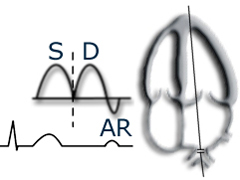
Pulmonary venous flow examination |
||||||
|
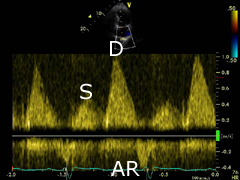
Left:
pulmonary venous flow can be assessed with PW-Doppler from the apical four-chamber view. |
|||||
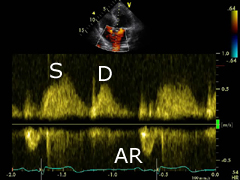
|
|
Left:
PW Doppler spectral display shows a larger systolic (S), a diastolic (D) and
a smaller end- diastolic wave (AR), the atrial contraction. |
||||
Echocardiographic parameters to assess diastolic LV function |
||||||
©
Derliz Mereles |
||||||
|
echobasics | free echocardiography tutorial online since 2004 |
||||||
 ORC
ORC